Last Updated on September 4, 2025 by Gill
Ever wondered why a powerful card still drops frames in some games? That question forces most builders to rethink assumptions about hardware harmony.
One-number “bottleneck” results rarely tell the full story. Online tools can be a starting point, but they ignore game choice, resolution, settings, thermals, and background apps. A system limit moves between cpu and gpu depending on the workload.
Set clear goals like target fps at your chosen resolution and tune components to meet that goal. Competitive titles at 1080p often stress the cpu for high frame rates, while big AAA games at 4K push the gpu harder.
Key Takeaways
- Don’t chase a percent score. Aim for real fps and smoothness instead.
- Understand that a bottleneck is simply the current limiting part of your system.
- Treat any calculator or calculators site as a rough reference, not a verdict.
- Optimize around your game library and chosen resolution for best results.
- Use monitoring and testing to find the actual limit, not generic tables.
What “bottleneck” really means for your system and games
In practice, one component often decides frame pacing during a run — but that part can change fast.
Bottlenecks shift with the application, settings, and time
Think of a bottleneck as the single part that limits performance in a scene. It can be the cpu when draw calls spike, or the gpu when resolution and effects rise.
Usage graphs move over time during a session. Short spikes are normal; sustained limits tell the real story. Forum experts note esports at 1080p often tax the cpu, while big AAA titles push the gpu.
What you’ll need before you start: monitoring tools, test games, and a plan
Pick two to three representative applications: an esports title and an immersive game are ideal. Use the same save or benchmark for repeatable runs.
- Install MSI Afterburner with RivaTuner or HWInfo to record per-core cpu, gpu utilization, clocks, temps, and fps.
- Disable background apps, note disk and thermal behavior, and track frames and stability over time.
- Treat any percent readout as a diagnostic tool, not a permanent label for your computer.
rtx 3090 bottleneck calculator: when to use it and when to ignore it
Generic percent outputs are tempting, but they rarely tell the whole story.
Why “overall % bottleneck” is misleading for CPU/GPU balance
A single percent can’t show whether the cpu or the gpu limits a scene. It also misses resolution, presets, and thermal throttling.
Context matters: resolution, settings, temperatures, and the specific game
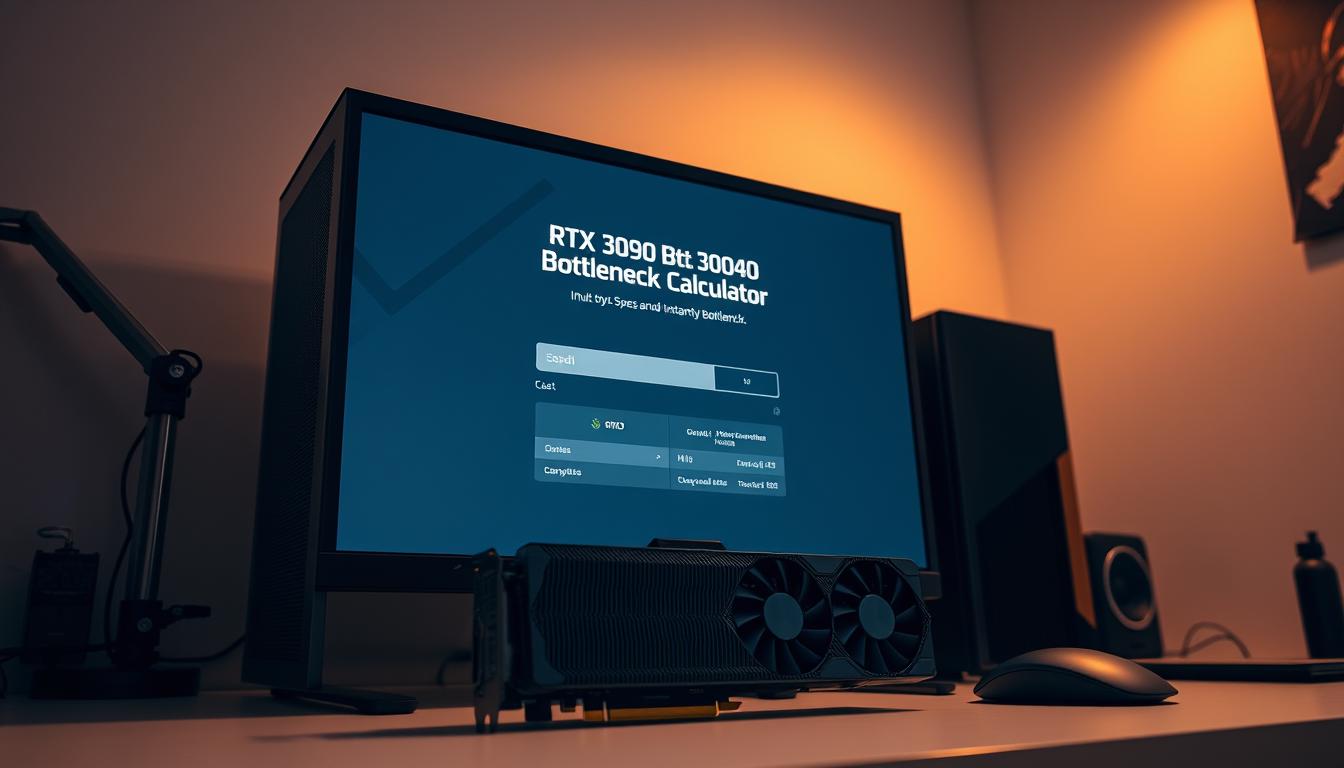
Forums show huge variance: the same build returned 18%, 1.87%, 3.42%, and 1.66% on different sites. That proves these tools are inconsistent.
Always consider your resolution, visual effects, and case airflow. Thermal issues can mimic a limit by causing throttles that skew reported numbers.
Using calculators as a starting point—not the final answer
Use a site or a tool only to guide tests. Then run real benchmarks and monitor cpu and gpu usage in your target game.
| Source | Tool Output | What to verify |
|---|---|---|
| Online calculator | Overall % score | Repeatable in-game fps and utilization |
| Forum reports | Varied results | Check temps and background apps |
| Local test | Measured fps / frametime | Real limit for your system |
Step-by-step: how to test CPU vs GPU limits the right way
Begin testing by creating a controlled, repeatable scene that you can run over and over.
Clean your test environment. Update GPU drivers, close background applications, free some storage, and set a consistent Windows power plan. Repeatable tests need the same starting conditions.
Enable overlays that show per-core cpu graphs, total gpu utilization, clocks, VRAM use, and fps/frametime. These metrics reveal which component is under stress.
Run a baseline at native resolution and target settings. If gpu utilization sits near 95–100% with steady clocks, the card is likely the limit. If a few cpu cores are pegged while the gpu has headroom, the cpu is the likely limiter.
Try resolution scaling: move from 4K to 1440p to 1080p. A big fps jump implies a GPU-bound scene. Little change suggests a CPU constraint. Change only one variable at a time.
Log short runs (60–120 seconds) and capture frames or CSV output. Repeat tests in an esports title and a demanding AAA game to confirm how limits shift by workload. Watch temperatures — thermal throttling can mimic a component limit.
| Step | What to watch | Action if true |
|---|---|---|
| Baseline run | GPU 95–100%, stable clocks | Lower resolution or GPU settings |
| Core spike | Few CPU cores near 100% | Adjust simulation/draw settings, check background apps |
| Resolution scaling | FPS rises sharply when resolution drops | GPU-bound — tune graphical features |
| Temperature spike | CPU or GPU temps hit throttle points | Improve cooling or case airflow |
Interpreting results by resolution and workload
How you set resolution changes whether the cpu or gpu carries the load in a given scene. Use this filter when reading test logs: resolution and workload shape which component limits fps and smoothness.
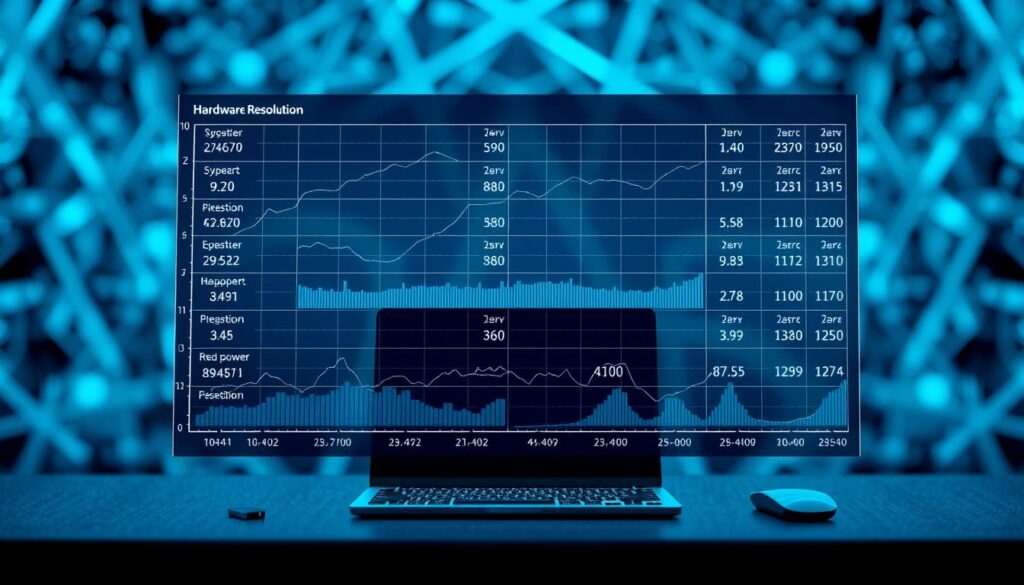
1080p — high FPS, often CPU-limited
Expect high frame rates. Esports titles and draw-call-heavy engines commonly push cores and threads first.
You may see low gpu utilization even with a powerful card when the cpu feeds frames as fast as it can.
1440p — mixed results, watch for spikes
This middle ground flips between cpu and gpu depending on scene complexity. Some moments show core spikes, others show near-max gpu use.
Track utilization during gameplay to spot which component jumps in different scenarios.
4K — GPU typically takes the lead
At high resolution, the graphics card usually becomes the clear limit. Near-maximum gpu utilization is normal.
Lowering visual features tends to raise fps more than changing cpu settings in these workloads.
- CPU sign: minimal fps change when lowering resolution or GPU settings.
- GPU sign: big fps gains after reducing shadows, ray effects, or resolution.
- If stutters persist despite good averages, check background applications, storage streaming, and drivers.
Bottom line: validate with monitoring tools and tests for your specific games. One percent score on a site is only a hint; real runs reveal the true limit for your system and the fps you want.
Fixes that actually move the needle on performance and responsiveness
Start by targeting the single gameplay issue you notice most — stutter, low fps, or sluggish input — then tune from there.
When you’re CPU-bound: cores, clocks, settings, and background applications
Prioritize higher clock speeds and stable cores. Lower simulation, AI, and draw-distance settings to reduce CPU work.
Trim overlays and background applications that steal cycles. Set Windows to a High Performance power plan and keep chipset drivers current.
Ensure storage has free space for streaming assets and disable unnecessary startup apps. Cap fps to match your display and enable adaptive sync to improve responsiveness.
When you’re GPU-bound: graphic card settings, resolution, and visual features
Reduce expensive effects first — ray tracing, shadows, volumetrics, and high anti-aliasing. Try upscalers like DLSS, FSR, or XeSS to regain fps without huge quality loss.
Drop resolution or use an intermediate scale (for example, 1800p instead of 4K) to balance quality and smoothness. Verify temperatures and improve case airflow if clocks drop under load.
| Scenario | Primary Action | Expected Result |
|---|---|---|
| CPU-limited | Raise clocks, reduce simulation, close apps | Lower frame variance, better frametimes |
| GPU-limited | Lower effects, enable upscaling, lower resolution | Higher average fps, steadier GPU use |
| Thermal throttling | Improve cooling, adjust fan curves | Restore sustained clocks and performance |
Final note: Treat any bottleneck readout or online calculator as a starting hint. Re-test after each change and measure real fps and frametimes to confirm gains.
Real-world pairing: Core i9-9900K and RTX 3090 across a variety of games
Hands-on runs across multiple titles reveal how a fast processor and a powerful card share work differently by resolution.
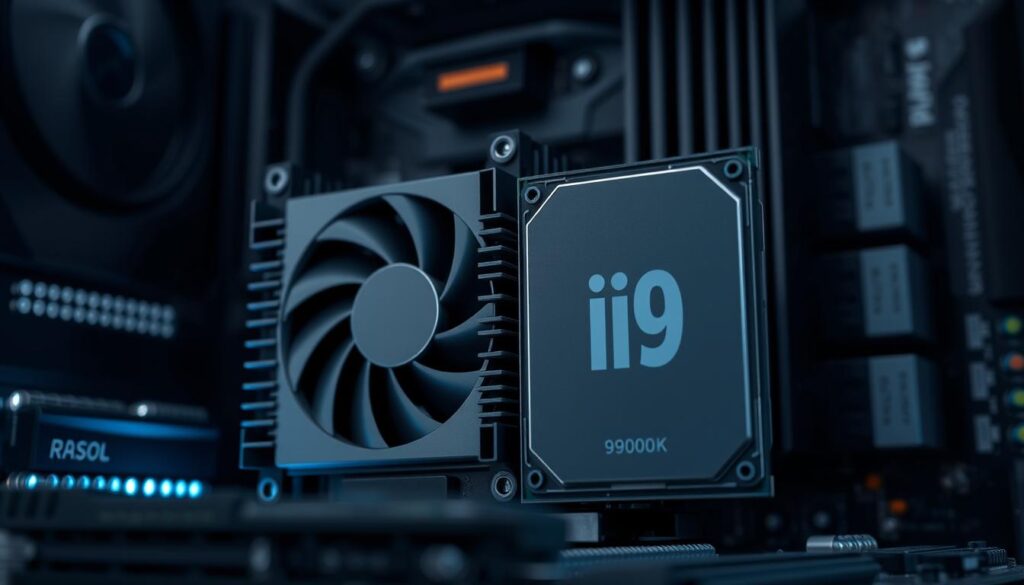
Case insight: why this processor rarely “bottlenecks” the card at higher resolutions
In actual tests, a core i9-9900 often keeps the cpu headroom at 4K and high settings. The graphic card takes most of the load, so the processor rarely limits frame rates in heavy scenes.
At 1440p the balance shifts by title. Some engines tax threads and draw calls, nudging a cpu limit. Other scenes remain gpu-bound and stress the card instead.
- 4K: system is usually GPU-limited; the core i9-9900 stays well within thermal and clock margins.
- 1440p: mixed results — monitor utilization per component to find the true limit.
- 1080p esports: the cpu can hit a practical limit when chasing very high fps and ultra-low frametimes.
Practical tip: test by resolution and workload, watch temps and utilization, and tune settings or applications to match your games and the computer you own. This avoids relying on a single percent readout or an online tool.
Conclusion
Wrap up testing with a clear, repeatable routine that tells you which part of the system limits real gameplay.
The best answer comes from your own tests, not one number on a site. Monitor cpu and gpu usage, vary resolution and settings, and log fps and frametimes to see which component is the limiter.
Treat any bottleneck calculator as a reference only. They lack the context of your resolution, workload, thermals, and background applications.
For owners pairing a core i9-9900 with a high-end card, expect strong results at higher resolutions; 1080p esports can still stress the cpu while 4K cinema-like scenes usually push the gpu.
Re-test after each tweak, keep storage and drivers healthy, and tune for the gaming experience you want.
FAQ
What does “bottleneck” mean for my system and games?
How do I check which part is limiting performance?
Are online calculators accurate for pairing a Core i9-9900 with a high-end graphics card?
Why is a single “overall %” result misleading?
How does resolution change whether the CPU or GPU is the limiter?
What practical steps help when the CPU is the limiting factor?
What should I change if the graphics card is the limiter?
How do temperatures and throttling affect perceived limits?
What tests should I run to get a clear picture of my system’s performance?
Will upgrading to a newer processor always fix a CPU-limited scenario?
How do I balance visual quality and frame rate effectively?
Are storage and memory relevant when diagnosing CPU/GPU limits?
Can driver updates change whether my system is CPU- or GPU-bound?
How often should I re-check my system after making changes?
- NVIDIA RTX 6000 Ada Generation 48 GB Bottleneck Calculation - October 17, 2025
- Optimize Your GeForce RTX 5070 Performance with Our Bottleneck Tool - October 2, 2025
- GeForce RTX 5090 Bottleneck Calculator: Optimize Your Setup - October 1, 2025

