Last Updated on August 27, 2025 by Gill
Wondering whether your new card will really run at full speed, or if another part is quietly holding you back?
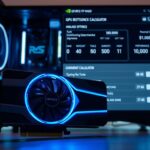
This friendly, step-by-step tool helps you spot whether your radeon 9070-class graphics card pairing is CPU- or GPU-limited, so you can avoid a bottleneck and squeeze out more performance without guesswork.
In plain gaming terms, a bottleneck caps FPS and harms frame pacing. It makes stutter and low frame rates more likely even if the card looks powerful on paper.
This guide is for builders, upgraders, and players who troubleshoot freezes or low FPS. Enter your exact CPU, card, resolution, and refresh rate to get estimated ceilings and the limiting component.
Think of the tool as a planning assistant, not a benchmark replacement. It saves time before you buy or tweak parts and shows obvious mismatches that cost performance.
Follow the walkthrough to read charts, apply settings tips, and compare nearby video card classes for clear upgrade guidance. Keep drivers updated and background apps light to turn the calculator’s insight into real gains.
Key Takeaways
- The tool flags whether your system is CPU- or GPU-limited at common resolutions.
- It estimates FPS ceilings and highlights the most limiting component.
- Use exact CPU and card names for the best results.
- It’s a planning aid, not a substitute for real-world benchmarks.
- Follow simple tweaks and keep drivers current to improve gaming performance.
What a Bottleneck Is and Why It Matters for Gaming Performance
The component that runs slowest per frame effectively sets the pace for every rendered second in a game.
CPU vs GPU limits: how frames are built and where time is spent
The processor and the gpu split the work to make each frame. The CPU issues draw calls, runs game logic, and updates physics. The GPU shades, rasterizes, and writes pixels.
Whichever side takes longer becomes the limiter and caps your FPS. At low resolution or detail, the CPU often rules. At high quality and resolution, the graphics hardware usually tops out.
When “graphics” isn’t the culprit: memory, storage, and background tasks
Not all issues are graphic. Low RAM can force paging, and slow storage can stall streaming in open worlds. Background apps can steal CPU time and ruin smoothness.
Competitive shooters often stress the processor; open-world games can stall on streaming. Use monitoring tools to watch utilization and confirm which component is limiting performance.
Before You Start: Information You’ll Need to Use the Calculator
Before you run any tests, gather exact specs so results match your real setup.
Key components to note:
- Exact processor model and whether your typical tasks are CPU intense (large-scale strategy, heavy physics, or high-FPS esports).
- The precise graphics card model and VRAM size so shader counts and throughput match the tool’s database.
- Memory capacity and speed (16–32 GB recommended) and whether it runs in dual-channel mode.
- Your monitor’s native resolution and target refresh rate (enter the resolution you actually play at: 1080 or 1440).
Also record storage type: an SSD reduces streaming stutter versus a hard drive even if average FPS stays similar. Update drivers, close background apps, and set Windows power to performance before testing.
Keep a short notes file with baseline settings and link to your motherboard pages for XMP/EXPO memory profiles. Accurate information up front produces far more reliable results and saves troubleshooting later.
Radeon RX 9070 XT Bottleneck Calculator: Step-by-Step How-To
Follow these quick steps to get reliable estimates for 1080 and 1440 testing.
Select the correct graphics card and processor from the tool
Start by picking the exact card entry and your processor so the tool models real-world pairings.
Choose the precise CPU model next—mislabeling either part will skew the result and hide genuine limits.
Set resolution and refresh targets for 1080 and 1440 gaming
Match your monitor by selecting 1080 or 1440 and the refresh rate you aim to play at.
The calculator uses that resolution to show whether the CPU or card dominates frame time.

Run and check bottleneck result for typical games and intense tasks
Use game profiles similar to what you play and add an “esports” preset for high-FPS titles.
Run multiple passes and then check bottleneck result panels to see limiter trends at 1080 and 1440.
Export, save time-stamped results, and compare configurations
- Export CSV or image for each run.
- Tag runs (e.g., “Stock RAM” vs “EXPO on”).
- Average passes to reduce variance before final comparisons.
“Save a short note about which limiter is dominant at each setting; that helps decide if the next step is tuning or an upgrade.”
| Step | Action | Why it matters | Tip |
|---|---|---|---|
| 1 | Pick exact card & CPU | Ensures model accuracy | Double-check model names |
| 2 | Set 1080 / 1440 and refresh | Targets the right limiter | Use your actual monitor setting |
| 3 | Run profiles & average | Reduces variance | Include esports preset if needed |
| 4 | Export & compare | Shows change over time | Tag configs clearly |
How to Read Your Bottleneck Result at 1080 and 1440
Start by reading the 1080 output, then compare it with the 1440 view to understand how load shifts.
Result 1080 vs result 1080 1440: why lower resolutions can be CPU bound
Read the bottleneck result 1080 first. At lower pixel counts the CPU often handles more frame setup and can limit peak fps.
Then open the result 1080 1440 view. Higher pixel counts push work to the GPU and can flip the limiter the other way.
Understanding FPS ceilings, frame-time spikes, and “percent bottleneck” notes
Use average fps together with frame-time graphs. High averages with big spikes point to intermittent CPU or storage stalls. Flat lines mean steadier performance.
The “percent bottleneck” number shows how often and how strongly a part gated frames. Treat it as a frequency indicator, not a precise percent loss.
“If the 1080 and 1440 reads disagree, both can be correct—many builds are CPU-limited at 1080 and GPU-limited at 1440.”
| Check | What it shows | Action |
|---|---|---|
| 1080 read | CPU-thread and scheduling limits | Try esports preset or reduce CPU load |
| 1440 read | GPU pixel and shader load | Lower quality or enable DLSS-like scaling |
| Percent bottleneck | Frequency of gating | Use frame-time charts to confirm |
Tuning Components to Reduce Bottlenecks
Match your in-game options to the part that is slowing frames and you’ll see steadier results.
Tasks GPU intense vs tasks CPU intense: matching settings to the limiter
For tasks cpu intense scenarios, cut CPU-side work. Cap background threads, lower crowd density or view distance, and enable an FPS cap to stabilize scheduling.
For tasks gpu intense scenes, reduce heavy post-processing, MSAA/SSAA, and resolution scale. This frees shader and pixel throughput while keeping clarity with TAA or an upscaler.
Practical tweaks: graphics presets, resolution scale, and memory timings
Start with a balanced graphics preset, then tweak the two or three settings the tool highlights rather than lowering everything.
Tighten memory timings or enable XMP/EXPO to give the CPU faster access to data. That often smooths frame-time spikes in borderline CPU cases.
- Enable Resize BAR/Smart Access Memory where supported to help intense tasks gpu handle texture and geometry churn.
- Consider modest CPU overclock or thread affinity for engines that suffer from scheduling contention in competitive titles.
- Keep the gpu fed with a safe power/thermal curve to avoid throttling in long sessions on a radeon 9070-class build.
“Validate each change by re-running the same test and comparing overlays; favor lower, steadier frame times over chasing peak FPS.”
| Scenario | Main tweak | Expected effect | Quick test |
|---|---|---|---|
| Tasks CPU intense | Lower view distance / cap FPS | Reduces CPU job queue, steadier frame times | Run esports preset & compare |
| Tasks GPU intense | Drop MSAA / resolution scale | Frees GPU shader/pixel time, raises avg FPS | Toggle post-process off and retest |
| Borderline cases | Enable XMP & Resize BAR | Faster memory and asset throughput, fewer spikes | Compare overlays before/after |
| Thermal/Power limits | Tune power curve & fans | Prevents runtime throttling for consistent performance | Long-play stress test |
Cross-Checking Performance Expectations Using Adjacent GPUs
Comparing similar GPUs gives a quick reality check on expected 1080p numbers.
Technosaurus tested a Sapphire RX 9060 8 GB Pulse at 1080p and found it about 19.8% faster than GeForce RTX 5050 on average across ten benchmarks and roughly 2% slower than GeForce RTX 5060.
Those deltas form a useful reference band. If your calculator output sits well outside that spread, your CPU or settings may be the cause rather than the card.
Remember the spec context: Navi 44 XL with 2,048 cores, 18 Gbps GDDR6 on a 128-bit bus gives ~288 GB/s. That bandwidth and clock profile explains why higher settings or 1440p push the gpu more and flip the balance away from the CPU.
“Use adjacent card comparisons at 1080 and 1440 to validate whether your numbers fit the expected performance envelope.”
| Check | What to expect | Action |
|---|---|---|
| 1080 reference | RX 9060 ≈ +19.8% vs RTX 5050, ≈ -2% vs RTX 5060 | Compare per-game; suspect CPU if far lower |
| Spec context | 2,048 cores, 288 GB/s bandwidth | Expect shader/bandwidth limits at 1440p |
| Upgrade planning | Use 1080 1440 geforce bands to size gaps | Estimate headroom before rtx 5070 class |
- Note CPU testbeds (Ryzen 7 9800X3D, Ryzen 5 7500F): stronger CPUs reduce CPU-side limits at 1080.
- Treat the numbers as directional; engine and setting variance will shift results in specific games.
Comparing RX 9070 XT Calculator Outputs with GeForce RTX Alternatives
A direct overlay of outputs shows how close your card sits to common GeForce bands at each resolution.
Use the tool to plot your radeon 9070-class output against 1080 1440 geforce reference bands. This highlights whether the limiter is on the CPU or the graphics side across common play targets.
1080 1440 GeForce RTX scenarios
At 1440 geforce rtx class loads you will usually see more GPU-bound behavior. Comparing your numbers to a geforce rtx 4060 band and a geforce rtx 5070 projection shows how much shader and bandwidth headroom each class offers.
When targets exceed 144 Hz at 1080 1440, CPU scheduling often narrows gaps between cards. In those cases, class-to-class differences shrink until fidelity rises and the GPU reasserts itself.
Practical checks for upgrades and creators
Content creators: factor encoder features and driver support alongside raw game performance. A card that matches gaming needs but lacks favored video features may still be a poor fit.
“If your output tracks near geforce rtx 4060 at 1080 but pulls ahead at 1440, that points to stronger shader/bandwidth balance for higher resolutions.”
- Verify power and cooling headroom before judging sustained performance—throttling distorts comparisons.
- For budget builds, align purchase with your actual 1080 or 1440 settings rather than theoretical peaks.
- Re-run the overlay after any CPU, memory, or driver change to confirm the expected shift in limiting component.
| Scenario | What to check | Action |
|---|---|---|
| 1080 (high Hz) | CPU scheduling limits | Cap FPS or upgrade CPU before swapping GPU |
| 1440 (ultra) | GPU shader/bandwidth headroom | Compare to geforce rtx 5070-class outputs |
| Video/editing | Encoder & driver features | Factor codec support into decision |
When Storage and Memory Become the Real Issue
A smooth scene depends on steady data delivery — and that means fast storage and enough RAM.
Moving from a hard drive to an NVMe SSD cuts asset streaming stalls in open-world titles. Textures and geometry load faster. That reduces the hitching you feel when traversing large maps.
Average fps may barely shift after the swap, but frame delivery becomes far more consistent. The result is a smoother, more predictable play experience.
System memory capacity and speed: avoiding paging and stutter
Aim for at least 16 GB of memory. Choose 32 GB if you multitask, run high-res texture packs, or stream while you play.
Enable XMP or EXPO to hit rated memory speeds. Slow or underclocked RAM raises CPU-side latency and can turn small delays into visible hitching.
“Insufficient RAM or a slow drive can mimic a CPU problem. Fixing them can avoid an unnecessary platform upgrade.”
- Monitor commit charge and the standby list while gaming to spot memory pressure.
- Run a simple A/B test: load the same scene from an HDD and from an SSD to compare traversal hitches and shader cache behavior.
- Schedule disk scans and cloud sync outside play sessions; background I/O can cause sudden stalls.
| Symptom | Likely cause | Quick fix |
|---|---|---|
| Intermittent hitching | Slow drive or background I/O | Move game files to NVMe SSD; pause sync apps |
| Spikes in frame time | Memory pressure / paging | Upgrade to 16–32 GB and enable XMP/EXPO |
| Unpredictable stalls on laptop | Thermal throttling of storage/memory | Check cooling and update firmware/drivers |
From Results to Purchases: Building a Balanced Gaming Computer
Use the data you exported to pick upgrades that actually raise your in-game frame rates.
Match your processor to the FPS you want and the graphics card to the visual quality you play at 1080 or 1440. That avoids common game issues and keeps the system balanced.
If results show a repeated CPU limit, prioritize a platform or processor upgrade before a bigger card. If the card is the limiter at your settings, step up a tier where real performance gains appear.

Plan purchases and future upgrades
Build a staged roadmap: CPU, motherboard, RAM, storage, cooling, and power. Leave budget for a quality PSU and case airflow so the card can sustain boost clocks without thermal drops.
Use your export history as a shopping checklist. It links each planned purchase to the specific limiter you’re solving.
“We may earn commission on qualifying purchases made via links to participating retailers site; this does not change the price you pay.”
| Need | When to buy | Expected result |
|---|---|---|
| Processor/platform | Persistent CPU limits at 1080 | Smoother frame times, higher capped FPS |
| Graphics card | GPU-bound at target settings | Higher averages at 1440, better visuals |
| Cooling & PSU | Thermal throttling or power headroom issues | Stable clocks and sustained performance |
Note: Timing purchases around sales and bundles stretches your budget. Re-test after each upgrade to confirm gains and avoid unnecessary buys.
Conclusion
This final check helps you turn measured data into a clear upgrade or tuning plan.
You used the tool to identify your primary bottleneck, learned how to read bottleneck result 1080 and result 1080 1440, and matched settings to the limiter. Small tweaks often reclaim frame-time consistency faster than big purchases.
When weighing a purchase, balance CPU and GPU paths for your preferred 1080 1440 targets. Compare against 1080 1440 geforce bands and 1440 geforce rtx references, but focus on how your computer performs over time.
Quick tip: rerun the test after any change to check bottleneck result and log settings, times, and outcomes. That information makes future purchases more targeted and cost-effective.
Thanks for reading — keep drivers, BIOS, and game builds current. Share your setups and results so others can learn from varied hardware and games.
FAQ
What does a bottleneck mean for gaming performance?
How do CPU and GPU limits differ when building frames?
Could memory, storage, or background tasks cause issues instead of the graphics card?
What information do I need before using the tool?
How does storage type affect gaming performance?
How do I run the calculator correctly?
Why does lower resolution sometimes show a CPU limit?
What should I look for in the bottleneck result metrics?
How can I reduce limits without swapping major parts?
Should I change settings based on whether tasks are GPU intense or CPU intense?
How can I use results from nearby GPUs to set expectations?
How do GeForce RTX alternatives compare across 1080 and 1440 scenarios?
When do storage and system memory become the real problem?
How should I pair a processor and graphics card to avoid common game issues?
Can I plan future upgrades using the calculator data?
Do you earn commission from linked purchases?
- NVIDIA RTX 6000 Ada Generation 48 GB Bottleneck Calculation - October 17, 2025
- Optimize Your GeForce RTX 5070 Performance with Our Bottleneck Tool - October 2, 2025
- GeForce RTX 5090 Bottleneck Calculator: Optimize Your Setup - October 1, 2025


