Last Updated on September 22, 2025 by Gill
Is your graphics card really the thing holding back your frame rate, or is something else to blame?
Start here to quickly find out whether your rtx 3060 is being held back by your cpu or other parts of your system. A bottleneck is any limit—hardware or software—that keeps your PC from delivering higher fps.
Our friendly bottleneck calculator compares average CPU and GPU frame capabilities per game and resolution. It then shows which component limits performance and by how much.
You’ll learn when the geforce rtx 3060 shines and when tuning settings is smarter than swapping parts. Because limits change by resolution and even by scene, this tool gives practical, game-ready advice.
Key Takeaways
- The bottleneck is the part that stops higher fps, and it can be hardware or software.
- Use the tool to compare cpu and graphics card averages for real-game estimates.
- Resolution and scene affect which component limits performance.
- Often the best move is tuning settings, not an immediate upgrade.
- The goal is balanced performance for the fps you care about, not zero limits.
Meet the RTX 3060 Bottleneck Tool for Accurate, Actionable Results
This tool turns real-game FPS data into clear guidance on which part of your PC limits performance.
What our bottleneck calculator evaluates in your system
The evaluator references measured average fps for tested CPUs and graphics cards across titles and resolutions. Each test runs at least three times, aiming for under three percent variance, then averages the results.
It assesses your chosen cpu gpu pairing and flags whether the graphics card or processor is constraining play. The output shows current limits and how they change with resolution or settings.
Why bottlenecks happen in real games and workloads
Games stress systems differently. Some scenes push the cpu — for example, flight sims load scripts and AI heavily. Other titles with complex shading and path tracing lean on the graphics card, so the GPU becomes the limiter.
Our game bottleneck calculator captures these shifts so you can pick the right fix — tweaking settings, improving cooling, or upgrading the part that truly limits performance.
- Stable averages from repeated runs give a trustworthy estimate of headroom.
- Behavior across the geforce rtx family is modeled to show tier differences.
- Results are actionable — not just numbers — to help you plan upgrades with confidence.
How the rtx 3060 bottleneck calculator works
We turn repeated in-game FPS runs into a simple percent that names the limiting part of your rig.
FPS-based methodology and percent bottleneck calculation
We model performance by aligning the CPU’s tested average frames per second with the graphics card’s average for the same game scene. Tests run at least three times and must stay within a small variance before we average results.
The percent bottleneck is a clear ratio. Compare the higher-capacity component’s FPS to the lower one. For example, if a cpu can do 200 fps and the graphics card averages 80, the limiting percent equals 1 − 80/200 (60%).
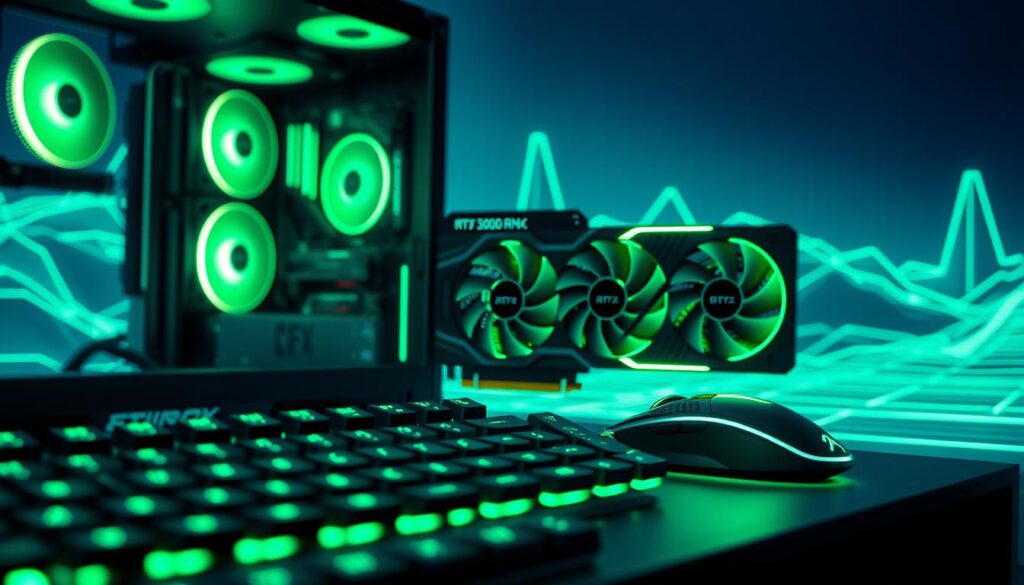
CPU- vs GPU-limited scenarios across 1080p and 1440p
At 1080, many systems show a cpu bottleneck because frame costs per pixel are lower and the processor has more influence over update rates.
Move to 1440 and pixel load rises. That often shifts the limit to the graphics card as shaders and memory bandwidth matter more. We report the result 1080 1440 so you see that shift plainly.
Why results vary by resolution, graphics settings, and game scenes
Different engines stress parts in different ways. Turning on ray tracing or a heavy upscaler changes how geforce rtx hardware scales and can flip which component limits play.
We pair nvidia geforce data with CPU measurements per title so the result 1080 1440 and 1440 geforce rtx behavior reflect real scenes, not theoretical peak numbers.
- Multiple passes reduce noise and improve confidence in the reported bottleneck.
- Output highlights whether a settings tweak or a parts upgrade will help most.
How to use the tool to check bottleneck and FPS
Start by picking your processor, graphics card, and display settings so the tool can model how your rig performs in real games.
Select CPU, GPU, resolution, refresh rate, and graphics preset
Choose the CPU and graphics card, set the resolution and refresh rate, and pick a graphics preset or game type. These inputs let the system match real test data to your setup.
Run analysis to see CPU/GPU bottleneck %, Avg/Max FPS, and balance status
Hit Analyze. The output shows CPU and GPU percentages, Avg FPS, Max FPS, and a balance label.
Avg and Max FPS tell you how the game will feel. The percent fields show which part limits performance so you can decide on tuning or upgrades.
Interpreting “Budget, Mid-Range, High-End, Unbalanced” matches
Labels map your pairing to practical tiers. A “Budget” match means one part outpaces the other for cheap upgrades. “High-End” signals headroom at your target refresh rate.
Use the geforce rtx 3060 option to compare alternatives. Save runs to compare a check bottleneck result after small setting changes.
- Pick components and settings, then analyze to check bottleneck.
- Read the bottleneck result and FPS numbers.
- Follow the suggested optimization steps or plan a targeted upgrade.
Understanding your bottleneck result at 1080 and 1440
Reading results for both 1080 and 1440 shows how pixel load shifts pressure between CPU and GPU.
When 1080 favors CPU limits and 1440 increases GPU load
At 1080p, many scenes stress the processor. Open-world hubs with lots of AI or physics can expose a cpu bottleneck even on fast systems.
Move to 1440 and pixel work rises. The graphics card takes more load, and the same rig often shifts to a GPU limiter.
Reading the “check bottleneck result” for practical performance targets
Look at the scene used for the test. Flight sims may still favor the CPU at higher resolution. Ray-traced games like Cyberpunk 2077 will usually push the graphics card.
If fps barely changes between 1080 and 1440, the CPU is likely the limiter. If fps drops a lot at 1440, the GPU set the cap.
“Use the 1080 1440 comparison to target realistic FPS goals — smooth play matters more than raw numbers.”
- Compare the result 1080 1440 per title, not just overall averages.
- Fix stutter and frame pacing before chasing higher FPS.
- Use nvidia geforce rtx trends to set 60–90 FPS targets at 1440 for solid quality.
From result to action: optimization tips and upgrade paths
After you get a result, practical steps can turn that data into smoother play without a parts swap.
Optimization first: settings, resolution, refresh, and sync options
Start with no-cost tuning to improve overall performance. Match refresh and frame caps to your goal and enable VRR, G-SYNC, or FreeSync.
Lower heavy post-processing and try resolution scaling before buying parts. These changes often help alleviate bottleneck improve frame times fast.
When to upgrade CPU vs GPU to improve overall performance
Test at native resolution and then at a low resolution. If FPS barely moves, the cpu is limiting; if it jumps, the graphics card needs an upgrade.
Consider a stronger cpu like the amd ryzen 7800x3d for thread-heavy engines. Move to a geforce rtx 4060, geforce rtx 5060, or geforce rtx 5070 when raster and RT throughput are the constraint.
Balanced build guidance and other tweaks
Pairing an amd ryzen 7800x3d with a mid-tier geforce rtx card gives smooth 1080p high-refresh play. For 1440p, favor higher-tier graphics cards.
Use dual-channel, low-latency RAM and a fast NVMe SSD to help alleviate bottleneck from asset streaming.
Overclocking, RAM, and storage considerations
Small CPU/GPU overclocks, better cooling, and stable power can improve overall performance. Re-test after each change and keep notes so you know what worked.
“Decide by whether your target FPS at chosen settings is met — tuning first, upgrade second.”
Accuracy, transparency, and current-generation context
We run each title several times on controlled benches to keep results clear and repeatable.
Data sources and FPS validation
All FPS values are measured in-house. Tests run at least three passes per title and setting. We average results only when variance stays under three percent.
Beta status and edge-case variability
The tool is in Beta. Expect small shifts as we add games and refine scenes.
Some titles stress the CPU while others push the graphics card. Treat each result as scene-aware, not absolute.
Retail links and commission disclosure
For convenience, some pages include links participating retailers. We may earn commission qualifying on purchases made links.
Any commission helps fund more hardware tests. It does not change conclusions about nvidia geforce rtx or other platforms.
| Test Item | Runs | Variance Threshold |
|---|---|---|
| Average FPS | 3+ | < 3% |
| Scene Types | Multiple per title | Reported separately |
| Hardware Notes | Documented benches | Updated with new hardware |
“We aim for transparent methods so you know what numbers mean for your system.”
Conclusion
Finish with a focused check so you know whether settings changes or new parts will actually raise your frame rate.
Use the tool today to check bottleneck and read your check bottleneck result. Compare your result 1080 1440 outputs: flat FPS between native and low resolution points to a CPU limit, while large drops show a GPU cap.
If your target FPS is met, a GPU limit is acceptable. If not, tune settings first, then consider an upgrade such as a geforce rtx 4060, geforce rtx 5060, or geforce rtx 5070 to better match your cpu and goals.
Re-run the analyzer after each change to confirm FPS gains. Keep checking your check bottleneck result as you tweak settings or swap parts to keep the system balanced for the games you play most.
FAQ
What does this tool evaluate in my system?
Why do performance limits occur in real games and workloads?
How does the FPS-based methodology calculate percent imbalance?
How do CPU- and GPU-limited scenarios differ at 1080p versus 1440p?
Why do results change with resolution, graphics settings, and game scenes?
What inputs do I need to use the tool to check system limits and FPS?
What results appear when I run the analysis?
How should I interpret “Budget,” “Mid-Range,” “High-End,” and “Unbalanced” matches?
Why does 1080p sometimes favor CPU limits while 1440p shifts load to the GPU?
How do I read the check result to set practical performance targets?
What optimization steps should I try before upgrading hardware?
When is it time to upgrade the processor versus the graphics card to improve overall performance?
What does a balanced build look like—any recommended pairings?
Can overclocking, RAM, or storage changes help alleviate limits?
How accurate are results and where does the data come from?
What limitations or variability should I expect across different games?
Are there notes about links to participating retailers and commissions?
- NVIDIA RTX 6000 Ada Generation 48 GB Bottleneck Calculation - October 17, 2025
- Optimize Your GeForce RTX 5070 Performance with Our Bottleneck Tool - October 2, 2025
- GeForce RTX 5090 Bottleneck Calculator: Optimize Your Setup - October 1, 2025

