Last Updated on September 20, 2025 by Gill
Is your system holding back the games you love? This quick intro shows how our hardware analysis tool spots the main limiting factor in your setup so you can make a confident choice about upgrades or settings.
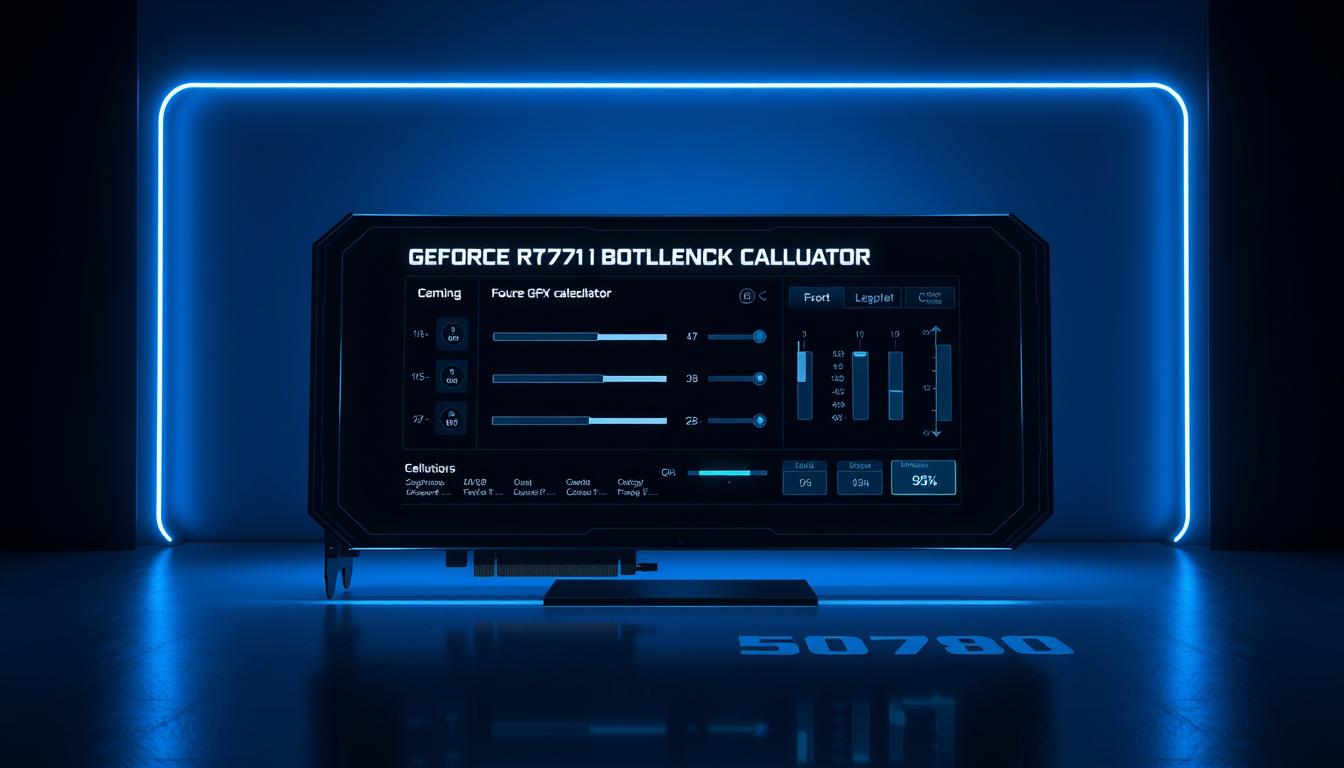
The friendly interface asks for simple inputs: resolution, refresh rate, graphics presets, game type, CPU and GPU. In moments, it displays clear results like CPU Bottleneck %, GPU Bottleneck %, Avg/Max FPS, and focused optimization tips you can act on today.
Whether you’re planning a build around a geforce rtx 5070 card or comparing to a geforce rtx 3060, the tool maps results to a Hardware Matching Reference. This shows Budget to High-End balance so you avoid wasted parts and wasted time.
Key Takeaways
- You’ll learn if the cpu or gpu limits your fps and why.
- Results include Avg/Max FPS and targeted optimization tips.
- The tool analyzes game settings and your components for real-world accuracy.
- A Hardware Matching Reference reveals balanced or unbalanced builds.
- Use one scan to plan upgrades and stop guessing which part to buy.
GeForce RTX 5070 Ti Bottleneck Calculator: How the Tool Analyzes Your Current Configuration
Provide your CPU, GPU, display, and game choices so the engine can map where limits appear in actual play.
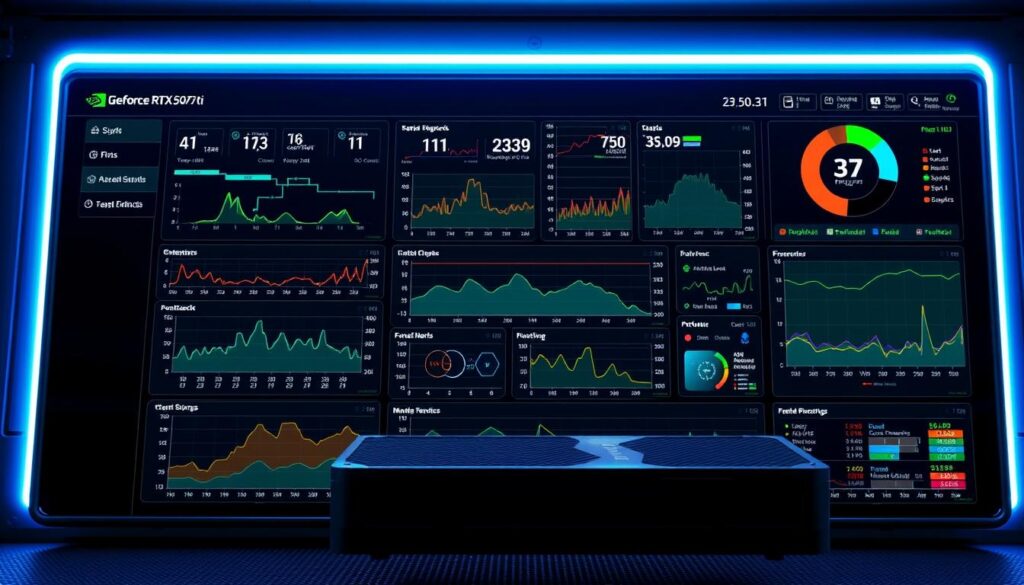
The tool accepts CPU, GPU, Resolution, Refresh Rate, Graphics Settings, and Game Type. After you submit, the dashboard shows an Analyzing… state while it runs the calculation.
When complete, you get clear results: CPU bottleneck % versus GPU bottleneck %, Avg FPS and Max FPS projections, and targeted optimization tips. The output highlights your current configuration and flags whether the build is Budget, Mid-Range, High-End, or Unbalanced.
Method and practical value
We use a limiting-factor approach that weighs thread scaling, resolution-bound load, and game type traits. That avoids overstating a single bottleneck and shows how multiple factors stack up.
- Enter components and settings to model real-world behavior across games and resolutions.
- The engine quantifies cpu and gpu bottleneck percentages and ties them to Avg/Max fps forecasts.
- Results come with optimization steps and upgrade recommendations, plus a hardware matching reference for confident decisions.
Understanding real-world performance factors for better gaming experience
Real play differs from lab numbers; we look at what actually limits your frame rate in real games.
As you raise resolutions and push higher refresh rates, the limiting factor often moves. At 1440p many systems shift from CPU-limited to GPU-limited, so the reported bottleneck percentages can swing toward the graphics side even with the same processor.
Resolution and refresh rate: why 1440p often shifts the limit from CPU to GPU
Higher resolutions demand more shader work and memory bandwidth. That makes the gpu the main constraint at 1440p. Small fps jumps—say 150 to 170—may feel minor depending on display type and frame pacing.
Game type and graphics settings: CPU-limited vs GPU-limited scenarios across titles
Fast-paced shooters at low resolutions commonly expose cpu limits like physics and net code. Open-world or ray-traced titles push graphics more and reveal gpu limits.
Adjusting shadows, reflections, and volumetrics shifts load between components. Memory and storage speeds also affect smoothness during asset streaming.
DLSS and frame generation: when to use them for smoother gameplay and higher FPS
DLSS reclaims performance by rendering at lower internal pixels and reconstructing detail. Frame Generation inserts interpolated frames to smooth motion.
These tools work best where visual quality is acceptable and latency is not critical. In slower single-player games with RT effects, FG can feel especially smooth. In twitch shooters, prioritize lower input lag.
Tip: Treat any bottleneck output as a guide. Test presets, measure again, and tune settings for the experience you want.
| Scenario | Likely Limiting Factor | Quick Fix | When to Check |
|---|---|---|---|
| 1440p, ultra settings | GPU | Lower ray tracing or enable DLSS | After graphics driver update |
| 1080p, high refresh | CPU | Reduce draw-heavy settings, enable CPU cores scaling | During multiplayer matches |
| Open-world, streaming assets | Storage / Memory | Upgrade to NVMe or add RAM | When you see stutter during traversal |
Smart hardware pairing for GeForce RTX 5070 Ti builds
Smart pairing focuses on the whole configuration so your new card actually delivers its promise.
CPU matches that play well
AMD Ryzen 5800X and similar amd ryzen chips still shine for 1440p gaming. The ryzen 5800x offers strong per-core speed that feeds a modern graphics card without forcing a platform swap.
Budget, mid‑range, and high‑end references
Keep the build balanced. A mid‑range processor with fast memory keeps the gpu busy. Budget builds should right‑size the cpu and memory to avoid wasted spend on the card.
Upgrades that matter and assessing results
Prioritize processor, memory, and storage. Faster memory kits raise minimums and NVMe cuts asset streaming stutters that steal FPS.
Use the tool’s bottleneck percentages to guide choices. If the cpu percent stays high across titles, plan a processor upgrade. If the gpu is consistently limiting at target settings, tune visuals or save for a future card.
Tip: Compare benchmarks before and after upgrades to confirm real gains and keep your hardware choices efficient.
Conclusion
Wrap up your tuning with a quick check that turns numbers into clear upgrade choices.
Treat each bottleneck as a solvable limiting factor. The tool shows CPU and GPU percentages, Avg/Max FPS, and whether your current configuration is balanced for the games you play.
Run the bottleneck calculation, review the cpu bottleneck readout, and try the optimization tips before buying parts. If limits persist across game types, follow the balanced-build guidance to improve your gaming experience.
When you upgrade, re-run the bottleneck calculator and keep a short benchmark log. Use settings or DLSS to hit your refresh target, and reserve hardware swaps for clear calculation results.
FAQ
What does the GeForce RTX 5070 Ti bottleneck tool analyze?
What outputs should I expect from the analysis?
How does the calculator determine which component is the limiting factor?
Which inputs most strongly change results between 1080p and 1440p?
How do game genre and settings impact whether the CPU or GPU limits performance?
Can technologies like DLSS and frame generation change the results?
Is the AMD Ryzen 5800X a good match for this graphics card class?
What upgrades usually give the biggest performance improvements?
How should I interpret the calculator’s balanced build flag?
Can I rely on the calculator for every game and every setting?
How often should I re-run the analysis?
What information do I need to enter for the most accurate result?
Will upgrading storage or RAM fix low FPS?
- NVIDIA RTX 6000 Ada Generation 48 GB Bottleneck Calculation - October 17, 2025
- Optimize Your GeForce RTX 5070 Performance with Our Bottleneck Tool - October 2, 2025
- GeForce RTX 5090 Bottleneck Calculator: Optimize Your Setup - October 1, 2025

