Last Updated on August 9, 2025 by Gill
Ever felt your computer stutter during a critical task? Maybe your game froze mid-battle, or your design software lagged while rendering. I’ve been there too—leaning back in frustration, wondering why this keeps happening. Often, the answer lies in your graphics hardware. Understanding your system’s capabilities isn’t just technical—it’s personal. It’s about reclaiming control over your workflow, gaming experience, or creative projects.
Modern graphics processing units handle everything from 3D modeling to AI computations. But without proper monitoring, you’re flying blind. Tools like Visual Studio Graphics Diagnostics reveal whether your app struggles with CPU limits or GPU bottlenecks. This matters whether you’re optimizing a Direct3D app or pushing hardware to its limits.
You don’t need to be a tech expert to benefit. Gamers spot frame drops before they ruin gameplay. Developers identify inefficient code paths. Even casual users extend their device’s lifespan through smarter resource use. We’ll explore built-in utilities and third-party solutions that turn vague hunches into actionable data.
Ready to transform guesswork into precision? Let’s dive into the metrics that keep your system running smoothly—and the strategies to fix what isn’t.
Introduction to GPU Monitoring
Ever noticed unexpected slowdowns during intense gaming or video editing? These hiccups often trace back to your graphics card working overtime. Tracking its activity isn’t just for tech experts—it’s about maximizing what your machine can do.
Why Track Graphics Hardware?
Regular tracking spots problems before they crash your workflow. It reveals if your system struggles with heavy loads or sits idle when it could handle more. Think of it like a car dashboard—you wouldn’t drive without checking the speedometer.
| Metric | Healthy Threshold | Tools That Measure It |
|---|---|---|
| Frame Rate | 60/30 FPS (marked in red) | Visual Studio, Ops Agent |
| Utilization | 70-90% during peak | Task Manager, NVIDIA DCGM |
| Temperature | Below 85°C | HWMonitor, MSI Afterburner |
Choosing Your Diagnostic Toolkit
Built-in tools like Windows Task Manager offer quick snapshots of gpu utilization. For deeper dives, third-party apps graph frame timing and memory use over time. Gamers might prioritize FPS counters, while developers analyze PCIe traffic patterns.
Modern dashboards color-code data—red lines flagging critical thresholds. This visual approach helps connect lag spikes to specific apps or settings. Whether optimizing gameplay or extending hardware lifespan, the right information transforms guesswork into strategy.
Understanding GPU Usage and Performance Metrics
Peeling back the layers of your graphics card’s activity reveals patterns that impact everything from gaming marathons to video exports. Metrics act as your decoder ring, showing why apps stutter or devices heat up. Let’s break down what these numbers mean—and how to act on them.
Key Metrics: Frame Rates, GPU Memory Usage, and More
Frame rate tells you how many images your system renders each second. Higher values mean smoother visuals, but watch for sudden drops—they’re like speed bumps in your gameplay. Paired with frame time measurements, you’ll spot whether delays come from rendering or data transfers.
GPU memory usage shows how much dedicated VRAM your apps consume. Exceeding 90%? That’s when textures might load slowly or crash programs. Tools track this alongside memory bandwidth, revealing if data highways are clogged.
Temperature and power draw round out the picture. Consistent high heat shortens hardware life, while unexpected energy spikes hint at inefficient settings. Keep thermal readings below 85°C for safety.
Interpreting Data from GPU Utilization Reports
Graphs transform raw numbers into stories. Frame time charts dipping below target lines signal smooth performance—like a car staying under the speed limit. FPS graphs work inversely: peaks above thresholds mean you’re winning the performance race.
Utilization percentages expose hidden workloads. A 95% reading during video editing? Normal. The same number while browsing? Something’s hogging resources. Cross-reference this with event logs to pinpoint rogue processes.
By connecting these dots, you’ll know whether to upgrade hardware, tweak settings, or kill resource-heavy apps. It’s not just data—it’s your roadmap to a faster machine.
How to Check GPU Usage and Monitor Performance
Ever been mid-project when your screen freezes? Proper preparation prevents those frustrating halts. Before diving into diagnostics, create ideal conditions for accurate measurements.
Preparing Your Environment for GPU Monitoring
Start by securing administrative rights. Most professional tools need elevated access to track detailed metrics. Verify your system meets minimum requirements—outdated drivers skew results.
Close background apps before launching diagnostics. Streaming services or chat programs can secretly consume resources. For clean data, focus your hardware’s power on the target application.
Initiating a Diagnostics Session
In Visual Studio, navigate to Debug > Performance and Diagnostics (Alt+F2). Check the GPU Usage checkbox—this activates the tracker. Combine it with memory analyzers for layered insights.
- Launch your application through the hub
- Watch real-time graphs populate
- Note sudden spikes during intensive processes
The tool automatically records frame durations and engine usage. These baselines help spot anomalies later. Remember—consistent setup steps mean comparable results across sessions.
Checking GPU Usage on Windows with Visual Studio Tools
Ever wondered what your graphics card does during those intense rendering sessions? Visual Studio’s diagnostic suite transforms raw data into visual stories. Its Performance and Diagnostics Hub acts like an X-ray machine for your applications, revealing hidden patterns in hardware utilization.
Navigating the Performance and Diagnostics Hub
Launch the hub via Debug > Performance Profiler (Alt+F2). Check both GPU Usage and Frame Analysis for layered insights. The interface displays three parallel timelines—CPU commands, GPU rendering, and memory transfers—separated by vertical vsync markers matching your display’s refresh cycle.
Color-coding simplifies pattern recognition. Blue spikes indicate heavy rendering, while orange segments highlight data transfers. Hover over any peak to see exact time stamps and associated processes.
Analyzing GPU Usage Reports
Click any event marker to see its ripple effect across timelines. A sudden frame drop might align with a memory-intensive operation in another thread. Use the profiling tool’s filters to isolate specific events or zoom into problematic time windows.
Advanced metrics like engine utilization percentages expose hidden bottlenecks. If copy operations consume 40% of your GPU’s time during rendering, consider optimizing texture streaming. Export these reports to compare performance across different Windows builds or driver versions.
Monitoring GPU Usage on Linux Systems Using the Ops Agent
Tracking graphics performance on Linux doesn’t require complex scripts or guesswork anymore. Google’s Ops Agent transforms raw hardware data into clear insights, whether you’re managing cloud servers or local workstations.
Getting Started: Installation Essentials
First, verify your system meets three requirements: NVIDIA drivers (version 450+), a supported Linux OS like Ubuntu 20.04+, and active sudo privileges. Uninstall older monitoring tools to prevent conflicts—they might skew your metrics.
Install the Ops Agent using Google’s repository. The process takes three commands:
- Add the cloud monitoring repository
- Run the automatic installer
- Enable GPU metric collection in the config file
Decoding Cloud Dashboards
Once running, the agent pulls data through NVIDIA’s NVML library. Cloud Monitoring displays GPU usage percentages and memory consumption per application. Color-coded graphs highlight which processes strain your hardware.
Look for these key indicators:
- Consistent 90%+ utilization: Time to optimize workloads
- Memory leaks: Steady climbs during idle periods
- Temperature spikes: Red flags for cooling issues
Version 2.38.0 introduced per-process tracking—perfect for spotting rogue apps. Combine this with real-time alerts, and you’ll fix issues before they crash critical tasks.
Understanding Advanced GPU Performance Metrics
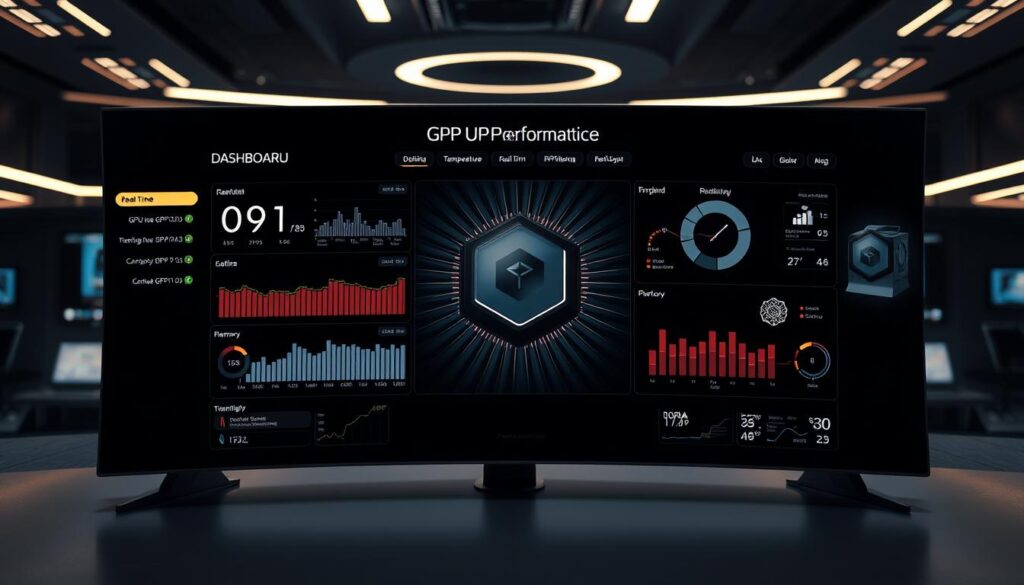
What if you could peek inside your graphics card’s brain? Beyond basic stats like temperature and frame rates lie metrics that reveal exactly how your hardware tackles complex tasks. These insights help squeeze every drop of power from your system—whether you’re training AI models or rendering 4K scenes.
Utilizing NVIDIA Data Center GPU Manager (DCGM)
NVIDIA’s DCGM acts like a microscope for enterprise-grade hardware. It tracks streaming multiprocessor (SM) activity—the tiny engines powering parallel computations. See how often these units sit idle or max out during workloads. This data helps redistribute tasks for better efficiency.
Integrated with Google’s Ops Agent, DCGM exposes metrics like PCIe transfer rates and NVLink traffic. These numbers show if data moves smoothly between components or gets stuck in bottlenecks. Note: P100 and P4 GPUs lack these features—plan upgrades accordingly.
Monitoring SM Utilization and PCIe Traffic
High SM utilization means your card’s cores work hard. But 90%+ occupancy might indicate inefficient code. Pair this with PCIe traffic rates to spot mismatches. Example: Low GPU memory usage but high PCIe transfers could mean unnecessary data shuffling.
Multi-GPU setups benefit from NVLink tracking. This reveals if cards communicate efficiently or waste time waiting for data. Memory controller stats add another layer—low cache hits suggest poor data reuse, forcing slower VRAM fetches.
By mastering these metrics, you’ll optimize workflows, extend hardware life, and crush performance ceilings. It’s like having a blueprint for your GPU’s hidden potential.
Comparing GPU Monitoring Tools and Dashboards
Choosing the right monitoring solution feels like picking the perfect dashboard for your car—some prioritize speedometers, others fuel efficiency. Visual Studio’s diagnostic suite and Google’s Ops Agent serve distinct purposes, each excelling in specific environments. Let’s explore how these tools differ and where they shine.
Development vs. Production Environments
Visual Studio’s GPU Usage tool thrives in coding workflows. It tracks Direct3D applications frame-by-frame, offering real-time feedback during debugging sessions. Developers love its timeline view showing CPU-GPU handoffs—perfect for spotting rendering bottlenecks before deployment.
Ops Agent dominates in Linux-based production settings. Its cloud integration monitors dozens of systems simultaneously, tracking memory leaks or thermal spikes across servers. IT teams use its historical data to predict hardware failures or optimize cluster workloads.
| Feature | Visual Studio | Ops Agent |
|---|---|---|
| Target Environment | Windows development | Linux production |
| Key Metrics | Frame timing, engine usage | Memory usage, PCIe traffic |
| Alert Systems | Manual analysis | Automated cloud alerts |
Tailoring Your View
Custom dashboards transform raw numbers into actionable information. Visual Studio users drag timeline markers to compare rendering phases, while Ops Agent builds widgets showing per-process VRAM consumption. Both tools let you:
- Highlight critical thresholds with color codes
- Export reports for team reviews
- Filter data by application or time window
Your choice hinges on workflow needs. Building a game? Visual Studio’s granular display helps polish every frame. Managing a server farm? Ops Agent’s scalability keeps all systems humming. Either way, tailored dashboards turn complexity into clarity.
Troubleshooting and Optimizing GPU Performance
Why does your system slow down when you need it most? Pinpointing the root cause transforms frustration into actionable fixes. Whether you’re battling lag spikes or optimizing workflows, strategic adjustments keep your hardware running at peak efficiency.

Identifying Performance Bottlenecks
Metrics reveal hidden roadblocks. High utilization paired with low frame rates often signals memory bandwidth limits. Thermal throttling creeps in when temperatures exceed 85°C—check cooling systems first. Multi-GPU setups face unique challenges, as some tools can’t track SLI/Crossfire configurations.
| Bottleneck Type | Symptoms | Solutions |
|---|---|---|
| Memory Bandwidth | High VRAM usage, texture pop-in | Reduce resolution, optimize assets |
| Thermal Throttling | Clock speed drops under load | Improve airflow, repaste GPU |
| SM Underutilization | Low core occupancy during tasks | Update drivers, adjust workload distribution |
Updating GPU Drivers and Adjusting Settings
Outdated drivers cripple performance. Always verify compatibility:
- NVIDIA: GeForce 400+ (v343.37+)
- AMD: Radeon HD 7000+ (v14.7 RC3+)
- Intel: 4th Gen Core CPUs (latest drivers)
After updates, fine-tune settings. Increase power limits for sustained boosts, but monitor temperatures. Balance memory clock adjustments with stability tests. Use benchmarking tools to compare performance before and after changes—this data-driven approach eliminates guesswork.
Remember: Multi-card setups require specialized tools. Validate fixes by tracking metrics over time, focusing on consistent improvements rather than one-off gains. Your GPU will thank you with smoother frames and cooler operation.
Best Practices for Regular GPU Performance Analysis
What separates a smoothly running system from one that constantly stumbles? Consistent tracking and smart scheduling. Regular analysis helps spot trends before they become emergencies, ensuring your hardware works smarter—not harder.
Establishing Performance Baselines
Start by capturing your system’s “normal” behavior. Run benchmark tests under identical conditions—same room temperature, background apps closed, and workloads repeated. Tools like Visual Studio’s GPU Usage tool let you delay data collection until specific triggers occur. This avoids cluttering reports with irrelevant startup phases.
Pro tip: Adjust settings via the Performance and Diagnostics hub. Postponed profiling works for most apps, except Direct3D 12 projects. Document these baselines alongside driver versions and system updates for accurate future comparisons.
Scheduling Regular GPU Usage Reports
Automate your workflow with these steps:
- Set calendar reminders for weekly or monthly checks
- Use cloud dashboards to track utilization trends
- Compare current gpu usage against historical patterns
Automated alerts flag deviations instantly. Did memory consumption jump 15% after a software update? Scheduled reports link changes to specific events, turning guesswork into actionable information.
Teams managing multiple systems benefit most. Track which machines handle peak loads efficiently and which need upgrades—all before users notice slowdowns. It’s like having a crystal ball for your hardware’s future.
Leveraging GPU Data for Enhanced Application Performance
What if every frame rendered could teach your system to work smarter? Modern applications thrive when developers harness GPU metrics strategically. This final piece connects insights to action, turning numbers into optimized workflows.
Integrating Metrics Into Development Workflows
Real-time data from tools like Visual Studio or Ops Agent becomes a coding compass. Spot rendering bottlenecks during debugging sessions by correlating frame drops with specific utilization spikes. Adjust shader complexity or texture streaming based on memory consumption patterns.
Teams sharing cloud dashboards synchronize efforts better. Color-coded alerts flag overheating risks before deployment. Version comparisons reveal how driver updates impact processes across devices.
Benefits for Developers and IT Professionals
For coders, this information shortens debugging cycles. IT staff predict hardware needs using historical GPU usage trends. Both groups gain:
- Faster identification of memory leaks
- Clearer upgrade justification through performance baselines
- Smarter resource allocation in multi-user environments
By treating GPU data as a continuous feedback loop, you transform raw stats into smoother experiences. Whether refining game physics or scaling AI training clusters, these insights become your silent optimization partners.
FAQ
Why should I track GPU utilization regularly?
What tools can Windows users access for GPU diagnostics?
How do I monitor GPU activity on Linux systems?
What key metrics define GPU performance?
How does NVIDIA Data Center GPU Manager (DCGM) help?
Can outdated drivers affect GPU performance?
Why establish a GPU performance baseline?
How do GPU metrics benefit developers?
What’s the easiest way to check real-time GPU usage?
Are custom dashboards worth using for GPU monitoring?
- NVIDIA RTX 6000 Ada Generation 48 GB Bottleneck Calculation - October 17, 2025
- Optimize Your GeForce RTX 5070 Performance with Our Bottleneck Tool - October 2, 2025
- GeForce RTX 5090 Bottleneck Calculator: Optimize Your Setup - October 1, 2025


