Last Updated on September 23, 2025 by Gill
Curious which part of your PC is holding back smooth frame rates? This focused tool helps you find out fast and with clear guidance.
Enter your CPU and GPU, pick resolution and refresh rate, and set game presets. The analyzer returns CPU and GPU constraint percentages along with estimated average and max FPS so you know where to tune first.
Designed for gamers who pair the Ryzen 7 5800X3D with common GeForce RTX cards, the service highlights results at 1080 and 1440 and gives direct optimization tips like driver updates, thermal improvements, and targeted hardware upgrades.
The page also offers a Hardware Matching Reference and a chart legend for Budget, Mid-Range, High-End, and Unbalanced builds. In a real example, pairing the chip with a GTX 1660 SUPER shows about an 18.73% GPU constraint, pointing to a graphics card upgrade as the best move for higher FPS.
Key Takeaways
- The tool estimates CPU/GPU constraint percentages and Avg/Max FPS for common video game setups.
- It supports inputs like resolution (1080, 1440), refresh rate, and graphics presets to tailor results.
- Optimization advice includes driver tuning, cooling, and targeted GPU upgrades when results show a GPU constraint.
- The Hardware Matching Reference helps spot unbalanced builds before you buy new parts.
- Examples with real hardware show when a GPU change yields real FPS gains versus chasing marginal CPU tweaks.
Why use a 5800X3D-focused bottleneck calculator right now
A focused check helps you decide whether a change matters for real gameplay.
Community discussions warn that generic tools can mislead without context. There is always one limiting component, so define your target first—like a steady 120 Hz—before you check bottleneck result numbers.
Why a dedicated tool helps:
- It matches common GPU pairings and shows results that reflect how the chip runs modern engines.
- It separates tasks cpu intense from tasks gpu intense so you can plan fixes correctly.
- It encourages skepticism of extreme percentages and quick “upgrade now” prompts.
“CPU‑heavy workloads will read as CPU limits; GPU‑heavy titles will show GPU limits.”
| Workload | Likely Limit | Quick Setting to Lower | Recommended Fix |
|---|---|---|---|
| GPU‑intense tasks | GPU | Ray tracing / high textures | Upgrade GPU or lower presets |
| CPU‑intense tasks | CPU | Draw distance / simulation | Optimize CPU settings or reduce background load |
| Mixed titles | Varies by title | Balance resolution and presets | Set target FPS, then check bottleneck |
Use the tool to check bottleneck and focus budget where it yields real gains, not on speculative tweaks.
How our 5800x3d bottleneck calculator works
Choose a target resolution and refresh rate first — that frames how the GPU or CPU will split work.
Start by selecting resolution, refresh rate, a graphics preset, and the game type. These choices shape engine load and let you check bottleneck result quickly for common result 1080 and result 1080 1440 scenarios.
Next, enter your CPU and GPU and any current configuration details. The tool models thread and shader use to predict how your specific combo will behave against typical titles and GeForce RTX pairings.
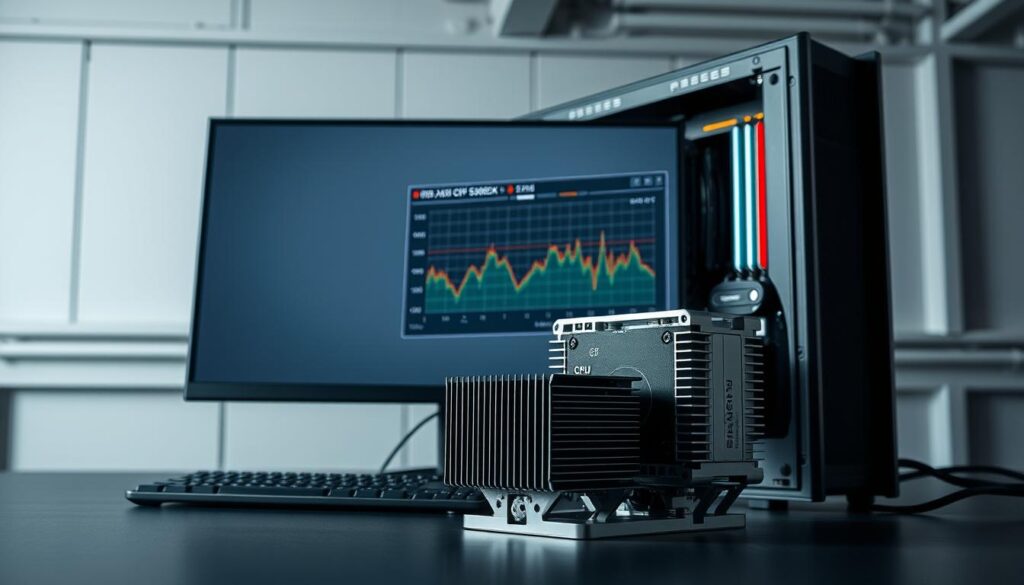
- CPU bottleneck percent and GPU bottleneck percent so you can check bottleneck in seconds.
- Estimated Avg FPS and Max FPS to compare result 1080 vs 1440 behavior.
- Optimization recommendations like driver updates, improved cooling, and utilization monitoring.
| Output | Example | Action |
|---|---|---|
| CPU % | 12% | Lower CPU‑heavy settings |
| GPU % | 18.73% | Upgrade graphic card or reduce GPU presets |
| Avg / Max FPS | 95 / 140 | Set target and retest |
The Hardware Matching Reference labels Budget, Mid‑Range, High‑End, and Unbalanced builds to guide upgrades for 1080 and 1440. Use it to see if a GeForce RTX upgrade or tuning will yield meaningful gains.
Interpreting bottleneck results at 1080 and 1440 for GeForce RTX GPUs
Compare results at 1080p and 1440p to see how pixel load shifts work between CPU and GPU.
Result 1080 vs 1440: what changes when you move up
At 1080, many engines stress the processor more, so a result 1080 readout can show higher CPU numbers. As you move to result 1080 1440, the heavier pixel load usually moves pressure to the graphics card.
Check bottleneck result: reading CPU and GPU numbers in context
Don’t treat percentages as commands. Look at frametimes, 1% lows, and your FPS target. A high CPU percent at 1080 can still feel smooth if frametimes are steady.
GPU‑intense vs CPU‑intense vs general tasks
- GPU‑intense tasks like high‑quality shadows and post‑processing spike the card.
- CPU‑intense tasks — draw calls, AI, scripting — push the processor.
- General tasks flip between the two by scene; monitor both tasks cpu and tasks gpu to decide tuning.
Real‑world example: why a GPU constraint is common at 1440
“Moving to 1440p typically shifts limits to the GPU; midrange GeForce cards often show GPU constraints around high teens to low twenties percent.”
That matches cases where a Ryzen 7 paired with a mid‑tier GeForce shows roughly an 18.73% GPU constraint at higher resolution. In short, if 1440 geforce rtx results peg the card, tune GPU settings before chasing a new part.
From insight to action: optimization and upgrade paths for smoother gaming
Turn raw numbers into a plan: upgrade paths, driver tweaks, and cooling fixes that actually change frame rates.
Graphic card paths for 1080 1440 play are straightforward. For high settings at 1080, a geforce rtx 3060 hits the mark. Step up to an rtx 4060 for high-refresh 1080p or entry-level 1440p.
For mainstream 1440p, consider an rtx 5060. If you want headroom and better ray tracing, aim for the geforce rtx 5070.
Driver and cooling matter as much as a new card. Keep drivers current using NVIDIA utilities and tune fan curves to sustain boost clocks.
Monitor GPU utilization and temps to spot thermal throttling. Improved airflow or an aftermarket cooler often tightens frametime variance without buying new hardware.
Match tasks to hardware
Map workloads to parts. GPU intense tasks like ray tracing, high shadows, and heavy post-processing need stronger geforce rtx cards.
Conversely, tasks cpu intense — AI simulation and complex scripting — benefit from the CPU’s cache and core performance.
“If analysis flags a GPU limit in result 1080 1440, prioritize a graphic card upgrade before a CPU swap.”
| Goal | Recommended Card | Why |
|---|---|---|
| High‑setting 1080p | gefórce rtx 3060 | Good price‑to‑performance for 1080 |
| High‑refresh 1080p / Entry 1440p | rtx 4060 | Balanced frame rates and efficiency |
| Mainstream 1440p | rtx 5060 | Better VRAM and pixel performance |
| High‑quality 1440p with headroom | gefórce rtx 5070 | Stronger ray tracing and futureproofing |
- Compare rtx 4060 vs rtx 5070 and rtx 5060 by price, VRAM, and expected uplift; always check bottleneck result 1080 after changes.
- Validate every upgrade with in‑game tests and a quick check bottleneck result to confirm gains for your favorite video game genres.
Understanding limitations: why bottleneck calculators need context
Set a clear performance goal for your favorite game before you interpret any performance readout.
Tools that show a single percentage can mislead without a target. A bottleneck calculator is helpful, but it is a tool — not a verdict.
There’s always a limiting component—set performance targets first
Decide if you want 60 FPS, 120 Hz, or max visual quality. With that goal, a tool’s bottleneck result gains meaning.
Different scenes shift pressure between CPU and GPU. In cpu intense tasks or when simulation threads spike, the processor can cap frames.
Community wisdom: treat extreme percentages and “upgrade now” prompts with caution
Community feedback calls out junk science in many online tools. Validate any alert with in‑game metrics, frametime graphs, and repeat runs.
“Validate wild percentages with real tests — thermal throttling and background apps often fake limits.”
- Use results alongside temps and power draw to confirm limits.
- Compare outcomes for general tasks cpu and intense tasks before buying parts.
- Let your real experience guide upgrades, not a banner ad.
Affiliate transparency and how we fund the tool
Learn how purchases through certain links support development and don’t change what you pay.
We want to be clear: we may earn commission when you buy gear through some links on this site. These partnerships help cover hosting, testing, and future improvements so the analyzer stays free to use.
How this works
- To keep the analyzer free, we may earn commission on qualifying purchases made after you click our product links.
- On participating retailers site pages, some product suggestions include made links participating in affiliate programs that support hosting and maintenance.
- Any purchases made links you follow do not increase your price; retailers share a portion of the sale and we earn commission qualifying only when qualifying purchases are completed.
What you should know
- We show clear context around links participating retailers so you can decide where to buy.
- Our team may earn commission based on qualifying purchases made, but rankings come from testing and user data, not payouts.
- If you prefer, visit a retailers site directly — the tool is available whether or not earn commission qualifying events occur.
“Transparency helps you make informed choices while supporting tools you use every day.”
Conclusion
Wrap up testing with a quick goal check so results point to useful upgrades, not guesswork.
Use the analyzer to set a clear FPS target and run tests at 1080 1440 to see how load shifts between CPU and GPU.
Practical steps: compare result 1080 vs result 1080 1440, expect more GPU pressure in 1440 geforce scenarios, and follow sensible geforce rtx upgrade paths that match your budget.
Validate any bottleneck result 1080 with in‑game frametime graphs and input latency. Use check bottleneck result and check bottleneck whenever you change drivers or parts.
Remember: a bottleneck calculator informs decisions, but stability, thermals, and real play feel should guide what you buy next.
FAQ
What does this tool tell me about my 5800X3D system?
How do I interpret CPU and GPU load percentages?
Will the results differ between 1080 and 1440 resolutions?
Can I trust the percentage numbers as exact facts?
Which NVIDIA cards should I consider for 1080 and 1440 if I need more GPU headroom?
What optimization steps give the biggest gains without buying new hardware?
How does the tool handle different game types and presets?
What about CPU‑heavy tasks outside gaming?
Why might the tool advise against an immediate upgrade even with high percentages?
Do you earn money if I buy a GPU from links on your site?
How do links to participating retailers work on the site?
- NVIDIA RTX 6000 Ada Generation 48 GB Bottleneck Calculation - October 17, 2025
- Optimize Your GeForce RTX 5070 Performance with Our Bottleneck Tool - October 2, 2025
- GeForce RTX 5090 Bottleneck Calculator: Optimize Your Setup - October 1, 2025

